- Blog
Google Analytics 4 – An In-Depth Guide
In October 2020, Google launched a new version of their web analytics tool that gathers and analyzes web traffic. This version is known as Google Analytics 4 (GA4) and is the new Google Analytics default (GA). Millions of organizations use GA to track marketing channels and their Key Performance Indicators (KPIs).
GA4 offers several features that set it apart from its predecessor, Universal Analytics (UA). One of the most significant of these is the new data modelling capabilities, which employ artificial intelligence (AI) to fill gaps left by UA. When considering whether to upgrade to GA4, organizations must evaluate these and other changes between the two versions of GA.
What Is GA4?
GA4 is also built on the same platform as Google’s “App + Web” system, which gives advertisers the ability to follow customers across applications, software, and websites. The primary purpose of all of these skills is to study user behaviour, particularly their route toward becoming consumers. Events are also an important aspect of GA4 since they specify how data is presented.
According to Google, the major goal of GA4 is to deliver a next-generation approach to AI-based predictive analytics, privacy-first tracking, and x-channel measurement. GA4’s powerful machine learning (ML) models also enable it to deliver statistics on user behaviour and website traffic without relying on page clicks.
GA4 is especially beneficial because website users are increasingly likely to decline cookie usage and other forms of data collecting. Additionally, Mozilla Firefox may now prevent GA, and many websites request visitor authorization to configure their GA monitoring.
GA4 Features
GA4’s key features include easy interaction with Google products, ML capabilities, and scalable cross-platform analytics.
Google Tools Integration
GA4 is deeply linked with YouTube, and Google is presently attempting to enhance its YouTube advertising campaign assessments. These modifications might enable users to track view-through conversions, which would allow them to assess the impact of a campaign on the participation of certain audiences, bounce rates, and website events.
GA4’s stronger connection with Google Ads enables users to conduct campaigns that give relevant and valuable offers to specified audiences, regardless of the device they use to browse the web.
Furthermore, the BigQuery Export option is free for all GA4 users, whereas this function is only available to UA-paying subscribers. GA4 now has resource options that enable users to enable data gathering in BigQuery cloud storage.
Machine Learning
One of the key advantages of Google Analytics 4 is its machine learning (ML) and natural language processing (NLP) capabilities, which allow users to assess the likelihood of converting a visitor into a client. Users may also utilise that probability to create audiences for Google Ads and receive updates on conversion patterns, such as how product demand is altering user needs.
GA4 can also forecast consumer behaviour, allowing users to make the necessary expenditures to keep them. Google will continue to improve GA4 by including new projections such as average revenue per user (ARPU), allowing customers to fine-tune their marketing campaigns and boost their return on investment (ROI).
Analytics on Multiple Platforms
Since there is no common standard of visitor behaviour, it has previously been difficult to examine a visitor’s shift from one platform to another, such as from a website to an app. UA, for example, bases its data on visitor sessions, but Firebase, Google’s platform for creating mobile and online applications, relies on events.
GA4 overcomes this restriction by employing an event-based analytics strategy that collects standardised data across many platforms. This method enhances data quality and offers customers a single report that covers all visitor pathways.
Universal Analytics vs. Google Analytics 4
Application developers and website owners switching from UA to GA4 must realise the distinctions between the two analytics services.
The Notion of Tracking
The way the two technologies track data is through a “data stream” in GA4, and they can be assigned to a single property. A data stream is a data funnel that begins with a consumer interaction point and ends with GA4. Each GA4 property may contain up to 50 data streams.
Modelling of User Entities
When you visit a website, you will likely be prompted to accept the cookie settings. After you accept the terms, the website that connects with Universal Analytics sends cookies to your web browser, allowing them to record and track your online activities during a certain session.
Unfortunately, websites are no longer the sole way for customers to communicate with businesses. People are increasingly engaging in in-app activities and obtaining information from different platforms where cookies are not available. Using only cookies makes it difficult to combine user behaviour data from numerous touchpoints to gain a comprehensive picture of their activities.
With GA4’s new user entity modelling—which supports both cookies and Google signals—you can now stitch the data together in a single consistent cross-device user experience. Google signals are data from Google users who have logged in. They can help replace the data void left by the lack of cookies.
Several Metrics
In GA4, a new measure called “engagement rate” or “bounce rate” indicator is introduced, which measures the percentage of single-page sessions that do not interact with the page. The length of a bouncing session is 0 seconds.
When assessing the behaviours of people who may have read a single page and then departed without taking further action, “engagement rate” is more relevant than “bounce rate.” Note that “the engagement rate” isn’t the reverse of the “bounce rate.”
Tracking Across Several Devices
Since you can group several data streams—a website or an app—into a property in GA4, you can now generate reports showing cross-domain traffic and aggregate statistics while allowing you to break down data by the stream.
Tools in Google Analytics 4
There are some significant variations between GA4’s tools, reports, and features and those from Universal Analytics that we’ll discuss in this part.
1. Reports
Google Analytics gathers information from your websites and applications to provide reports that give insights into your organisation. Reports can be used to monitor traffic, analyse data, and better understand your users and their activities.
When Analytics receives data, it displays in the Realtime report first, and then in your other reports shortly after. Some of the data in your reports are gathered directly from your websites and applications when you set up Google Analytics, while other data requires some further configuration. The following is an example of a report in Google Analytics:
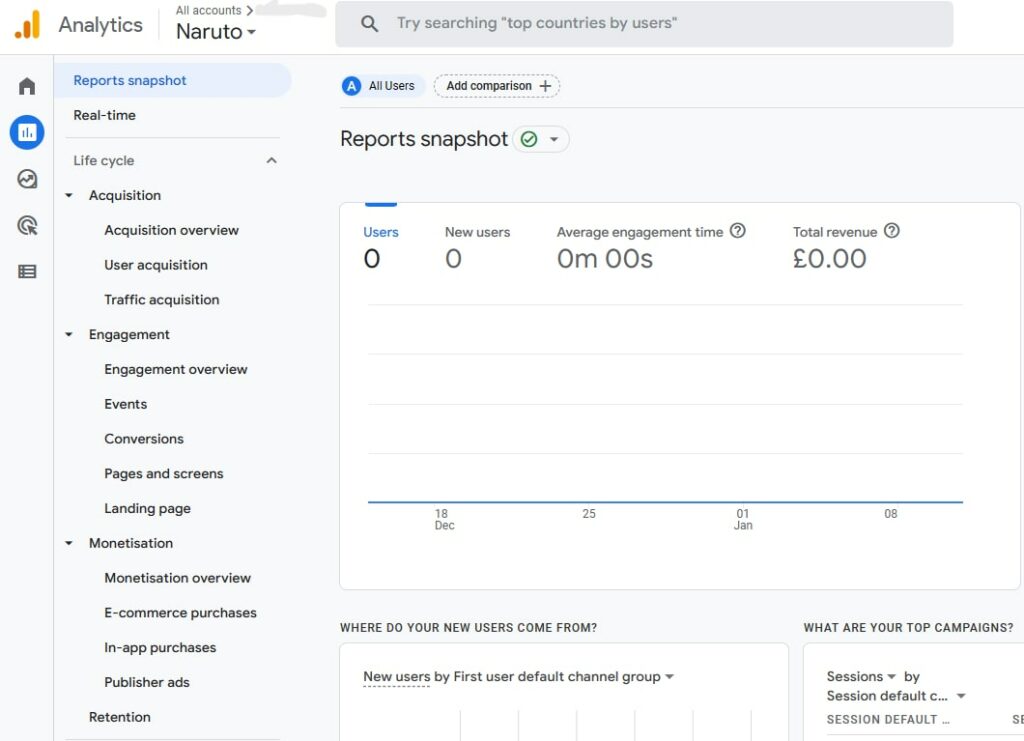
You can modify the reports that show on the left, as well as the information contained in each report. While Analytics delivers a specialised set of reports for your organization, modifying the reports and navigation allows you to further adapt the interface to match your needs.
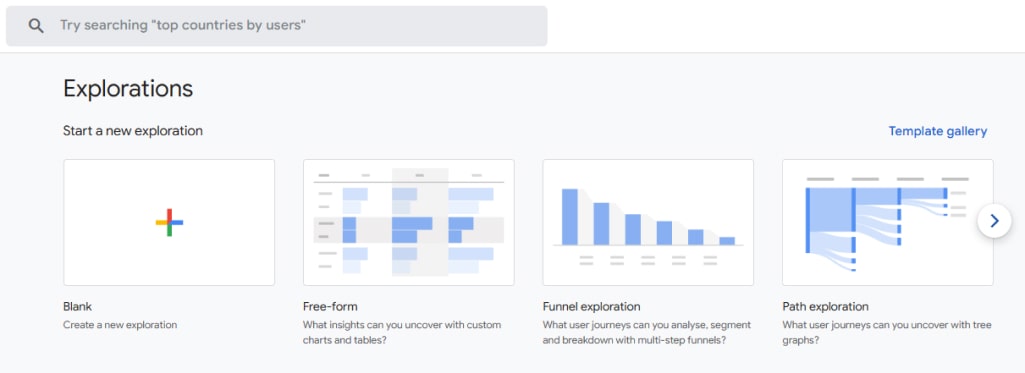
2. Explorations
Google Analytics’ default reports assist you in monitoring crucial business indicators. Explorations provide access to data and analytical approaches not available in reports. Use Explorations to go deeper into your data and answer relevant questions about it.
An exploration is divided into three sections:
I. Canvas
The large segment on the right shows your data using the technique you’ve chosen. The canvas can be divided into tabs, allowing you to employ several techniques in a single exploration. The following approaches are supported by Explorations:
Free-form Exploration
Investigate your data using a familiar crosstab structure. In free form, you may also use a variety of visualisation methods such as bar charts, pie charts, line charts, scatter plots, and geo maps.
Cohort Exploration
Learn from the behaviour and performance of groups of users that have similar characteristics.
Funnel Exploration
Visualize the steps visitors take to accomplish activities on your website or app to understand how you can improve user experience and identify high- and low-performing audiences.
Overlap of Segments
Examine how various user segments interact with one another. Use this strategy to find new user groups that match stringent requirements.
User Exploration
Examine the users who comprise the segments that you generate or import. Individual user behaviours can also be drilled down into.
Path discovery
Visualize your users’ journeys as they engage with your website and app.
User Lifetime
Investigate user behaviour and value across the course of their customer lifetime. Here is how some of the explorations look. You can add more according to your needs.
II. Variables
You can access the parameters, metrics, and divisions you may use for the exploration in the panel on the left. In the Variables panel, you can also modify the exploration”s timeline.
III. Tab Options
To customise the tab that is presently chosen, use the options in the Tab Settings panel. Choose the technique, add variables from the Variables panel, and set up the parameters unique to that approach.
Here is how some of the explorations look. You can add more according to your needs.
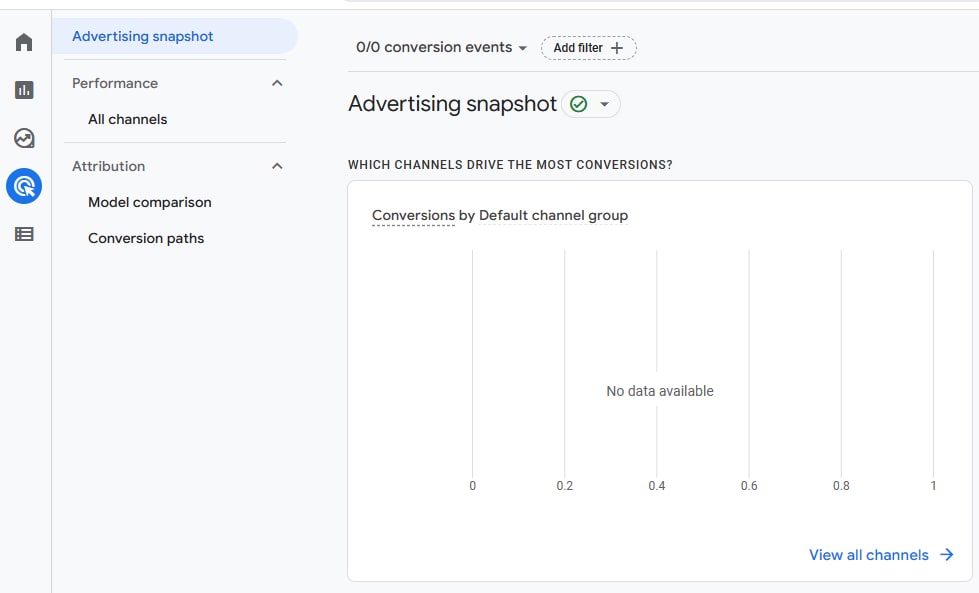
3. Advertising
Analytics Advertising Features is a suite of features that use Google advertising cookies to allow you to achieve things like:
- Create and distribute Remarketing Audiences based on precise behaviour, demographic, and interest data with Google Ads.
- Incorporate demographic and interest information into your Analytics reports.
- Make segments based on demographic and interest information.
If you select the Advertising tab, you will be sent to the Advertising snapshot screen. The channels and touchpoints that produce the greatest conversions on your site are displayed here:
Should You Switch to Google Analytics 4?
Before switching from UA to GA4, users must weigh several advantages and disadvantages.
Pros
One of the most significant benefits of GA4 versus UA is its AI and ML capabilities. These features make GA4 a more robust analytical tool, allowing it to forecast the future. Although it is far from perfect, GA4 can already alert users to emerging patterns.
ML enables users to make greater sense of the data they collect, allowing them to precisely forecast visitor behaviour.
Another useful feature of GA4 is codeless event tracking. Users may now track events in real-time without requiring any coding experience, offering greater insight into how users interact with a website.
Cons
Users with extensive expertise with UA may be hesitant to switch to GA4 owing to the numerous changes that GA4 offers. These modifications have a significant impact on the data that consumers get and how they see it. For example, the tools for gathering, evaluating, and reporting data are now independent, giving GA4 users additional alternatives. The data arrangement is also different since UA contains levels of data.
Aside from coping with a new display and dashboard, you”ll also need to adjust to the new reporting view. Engagement indicators in the GA4 reporting view include Engaged Sessions, Engagement Rate, Engaged Session per User, and Engagement Time. GA4 may be more hassle than it”s worth if you don”t have an app.